
Financial statement analysis is essential for assessing a company’s performance and financial health. Two common methods used are horizontal analysis and vertical analysis, both of which provide valuable insights into trends and financial structure.
Horizontal Analysis: Tracking Financial Trends Over Time
Horizontal analysis, also known as trend analysis, compares financial data across multiple periods. It helps identify growth patterns, declines, or inconsistencies in revenue, expenses, assets, or liabilities over time. This is done by calculating percentage changes between periods to track financial performance.
For example, if a company’s revenue grew from $1 million to $1.2 million over a year, the percentage increase would be (1.2M – 1M) / 1M = 20%.
This type of analysis helps businesses and investors spot long-term trends and make informed decisions.
Vertical Analysis: Understanding Financial Structure within Same Period
Vertical analysis, also known as common-size analysis, looks at financial statements by expressing each item as a percentage of a base figure within the same period. This allows for easy comparison across companies of different sizes and highlights the financial structure.
For instance, on an income statement, net income might be expressed as a percentage of total revenue, while on a balance sheet, assets might be expressed as a percentage of total assets.
If a company has total revenue of $500,000 and cost of goods sold (COGS) of $200,000, vertical analysis would show: (200,000 / 500,000) = 40%, which means that 40% of revenue is spent on COGS, providing insight into cost efficiency.
Worked Example
Horizontal analysis and vertical analysis both help businesses and investors to:
- Identify financial trends and patterns over time (horizontal analysis)
- Understand a company’s cost structure and efficiency (vertical analysis)
- Compare performance across companies or business units, regardless of size
By applying horizontal and vertical analysis, businesses can make smarter strategic decisions, and investors can assess financial stability more effectively. Following is a worked example of how these techniques can be applied in practice.
As a publicly traded company, Home Depot publishes their financial statements online. Following is the balance sheet for January 28, 2024 (Target Year) and January 29, 2023 (Base Year) as made publicly available (Home Depot, 2024). Analysis template is based on UIS lecture notes (Peterson, 2025).
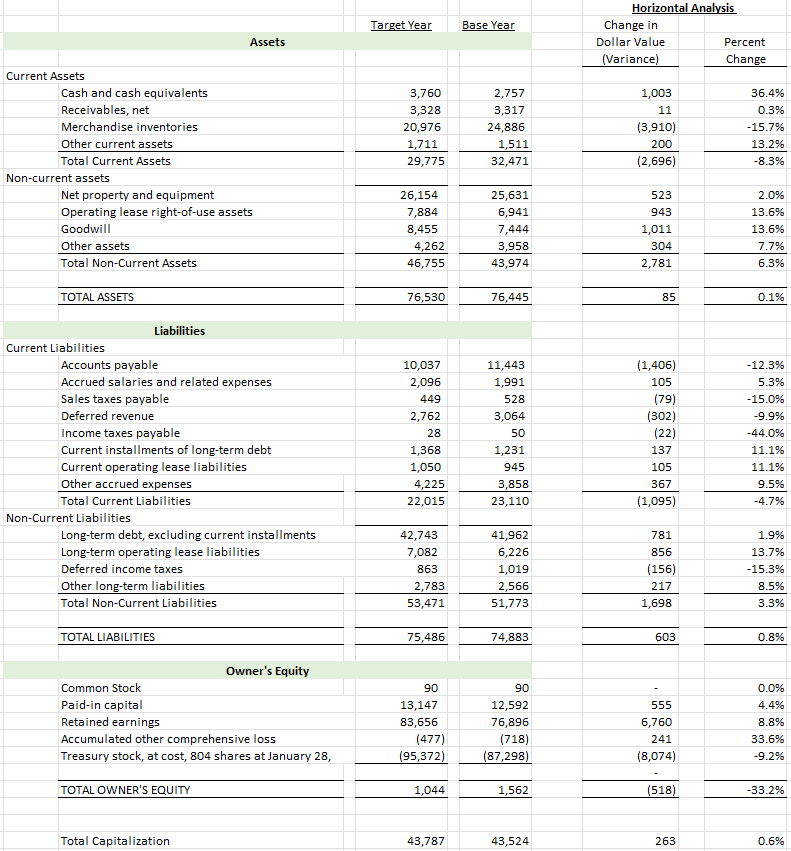
From this analysis we can see that Home Depot’s total assets were nearly flat at just 0.1%, with a -8.3% notable decrease in current assets, driven by a drop in inventory of -15.71%. Cash and cash equivalents increased significantly by +36.38%, indicating stronger liquidity. The significant drop in inventory suggests that Home Depot is most likely managing inventory more conservatively, possibly due to slower consumer demand, or a shift in purchasing strategy. A lower inventory level can help reduce carrying costs and improve cash flow, but it may also lead to stock shortages if demand suddenly spikes.
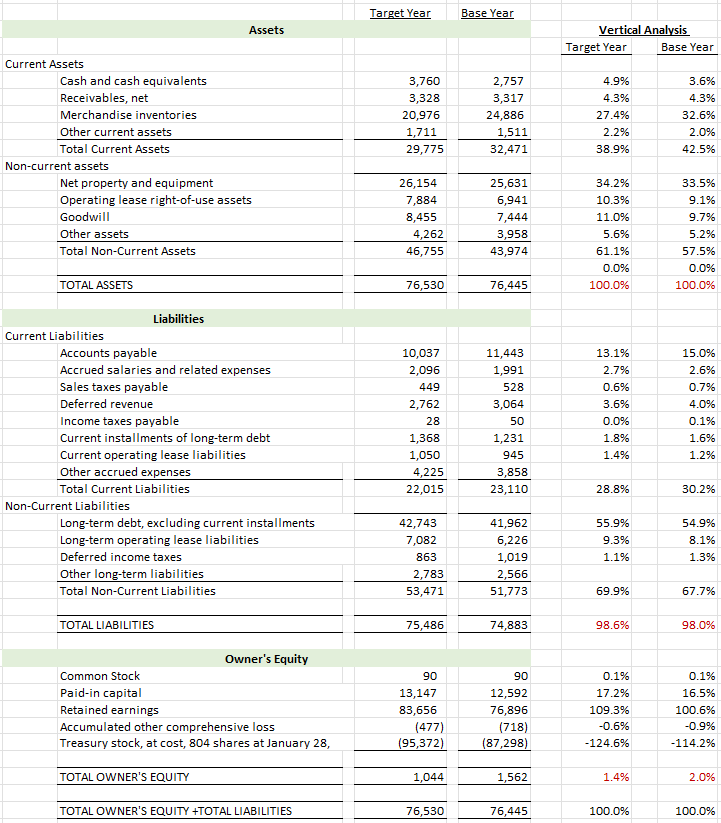
Current assets as a percentage of total assets declined from 42.5% to 38.9%, largely due to lower inventory levels. This suggests that Home Depot has been reducing its reliance on short-term assets, particularly merchandise inventories, which fell by 5.2% year-over-year (from 32.6% to 27.4%). This suggests Home Depot has improved inventory management, or supply chain efficiency, but this could also be due to weaker consumer demand requiring fewer stockpiles.
References:
Home Depot. (2024, March 13). 2023 Home Depot annual report. Retrieved from https://ir.homedepot.com/~/media/Files/H/HomeDepot-IR/2024/_2023_HD%20Annual%20Report%20-%20Combined%20IRsite_VF.pdf
Peterson, C. R. (2025). Lecture 8: Working with financial statements [Excel file]. Retrieved from https://uispringfield.instructure.com/courses/15569/pages/module-6-lecture-materials-lecture-8-2-2?module_item_id=804049

Leave a comment