
This week we explored how some of the previously learned finance concepts can be applied to real-world financing decisions, including valuing stocks and bonds and making capital investment choices.
Companies have three primary ways to raise capital:
- Reinvesting profits
- Issuing stocks (equity financing)
- Borrowing money through bonds or loans (debt financing)
Stocks represent ownership in a company allowing businesses to raise funds by selling shares to investors. In contrast, bonds enable companies to secure capital without giving up ownership, as they function like loans with fixed interest payments.
Bonds:
I had heard the term bonds many times before but never really took the time to understand what they meant, even though I knew the bond market was significantly larger than the stock market. This week, I finally learned about bonds!
A bond is essentially a loan made by an investor to a corporation or government. In return, the issuer promises to repay the principal amount at maturity while making periodic coupon payments (interest) along the way.
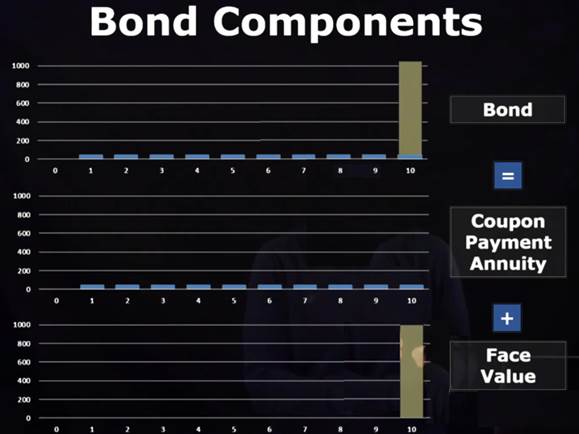
A bond consists of two main types of cash flows:
- Coupon Payments – Regular interest payments made throughout the bond’s term.
- Face Value (Principal Repayment) – A lump sum paid back at maturity.
Bonds provide a structured and predictable return, making them a popular choice for income-focused investors looking for lower-risk investments compared to stocks. This diagram breaking down bond cash flows really helped clarify this concept for me (Regan, n.d., Bonds):
One detail I never quite understood was why bond prices typically drop as rates rise. This is because of the inverse relationship between bond prices and yields. Higher interest rates make existing bonds with lower yields less attractive, reducing their market price. Conversely, when interest rates fall, older bonds with higher coupon rates become more desirable, pushing their prices higher. For instance, if I hold a 5-year bond paying 3% interest while new bonds are issued at 5% interest due to rising rates, I would prefer the new bond paying 5% over your 3% bond unless the bond’s price dropped to a level where it offered a competitive yield.
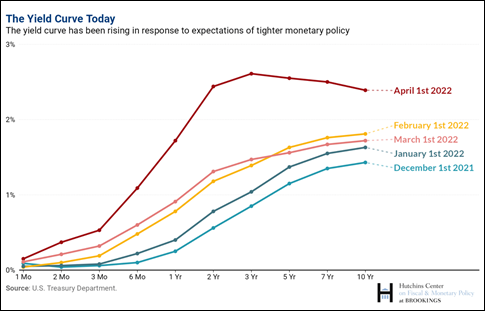
The interest rate (or yield) on bonds is influenced by the benchmark rate set by the U.S. Treasury. Generally, the longer the duration of a bond, the higher the interest rate it offers to compensate for increased risk. However, bond rates fluctuate daily based on market conditions.
For example, in early 2022, the yield curve shifted upward as the Federal Reserve began raising interest rates from near zero in order to better control rising inflation, signaling to investors that borrowing costs would continue to increase (Wessel & Alcalá Kovalski, 2018).
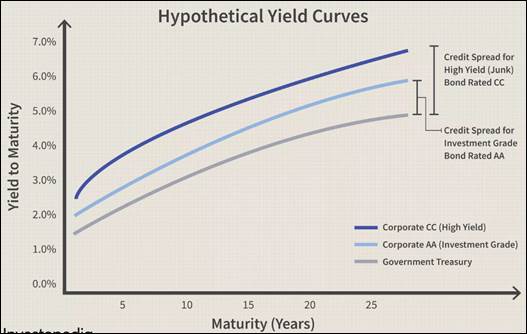
Treasury bonds are backed by the US Treasury and have the lowest risk. For higher risk bonds offered by companies, the rate is usually higher, and the curves would look something like (Harper, 2022):
With that understanding, a bond’s present value can be calculated using these formulas (Regan, n.d., Bonds) where g is 1 for constant payments:
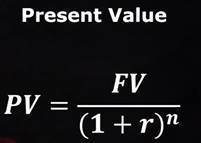

For sub-annual problems, r becomes (r/p) and n becomes (np) where p is the number of period per year. These formulas can be used to answer questions like (Regan, n.d., Bonds):
- What is the current value of a zero-coupon bond that pays a face value of $1,000 at maturity in 8 years if the appropriate discount rate is 6%? (FV = $1,000, n = 8, r = 6%, PV = ?)
- A corporate bond newly issued by Forté Foods pays the bondholder $1,000 in ten years. The bond also includes ten annual coupon payments of $50 with the first occurring one year from now. Using a discount rate of 5%, how much would you pay for this bond? (PMT = $50, r = 5%, n =10, FV = $1,000, g = 0, PV = ?)
- Consider a $1,000 bond with a 6% annual coupon rate (paid semi-annually) that matures in 7 years with the next payment occurring six months from now. What should the bond price be? (FV = $1,000, n = 7, p = 2, r = 7.3%, PV = ?)
We can use manual calculations or the Excel functions like PV, FV, PMT, RATE to determine the answers.
Net Present Value (NPV)
At the core of capital investment decisions is the concept of NPV, which helps assess the value of future cash flows in today’s terms. NPV is a critical tool for evaluating investment opportunities, capital budgeting decisions, and business strategies by comparing the present values of expected future benefits.
NPV is particularly valuable because different projects often have varying time horizons, cash flow patterns, and growth rates, making direct comparisons difficult. By discounting all future cash flows to their present value, NPV provides a common baseline for evaluating investments. NPV is also useful when deciding between mutually exclusive projects (where only one can be selected) or independent projects (where multiple investments can be pursued).
By discounting future cash flows to their present value, NPV allows businesses to compare different investment streams and make informed decisions.
For NPV, we use the same PV formulas which can be used to answer questions like (Regan, n.d., Net present value):
- A firm that purchases electricity from the local utility is considering installing a steam generator. A large generator costs $280,000 whereas a small generator costs $200,000. The cost of operating the generator would be $200,000 per year for the large and $220,000 for the small. Either generator will last for five years. The cost of capital is 11%. For each generator option, assume immediate installation, with purchase and operating costs in the current year and operating costs continuing for the next four years. Assume payments under both options at the start of each year (i.e., immediate, one year from now,…, four years from now). What is the net present value of the more attractive generator?
- A prospective MBA student earns $50,000 per year in her current job and expects that amount to increase by 12% per year. She is considering leaving her job to attend business school for two years at a cost of $45,000 per year. She has been told that her starting salary after business school is likely to be $85,000 and that amount will increase by 15% per year. Consider a time horizon of 10 years, use a discount rate of 11%, and ignore all considerations not explicitly mentioned here. Assume all cash flows occur at the start of each year (i.e., immediate, one year from now, two years from now,…, nine years from now). Also assume that the choice can be implemented immediately so that for the MBA alternative the current year is the first year of business school. What is the net present value of the more attractive choice?
- Vera’s compensation includes a 10-year annuity that pays $60,000 at retirement, with each subsequent payment growing by 2.5%. Vera’s firm’s policy is to pre-fund such annuities one year before retirement. At 6% interest, how much would the firm need to invest?
The answers can be determined by forecasting future cash flows using the given growth rate and then discounting each one to its present value using the given discount rate. The PVs of all future payments are then summed up to find the total NPV (can be calculated manually, or using NPV function in Excel). The investment or project with the highest NPV is typically the most favorable, as it represents the greatest expected return accounting for the time value of money. However, two or more smaller projects with a higher combined NPV can also be considered depending on other factors such as diversification, risk tolerance, available resources and strategic fit.
References:
Harper, D. R. (2022, October 30). Corporate bonds: An introduction to credit risk. Investopedia. Retrieved from https://www.investopedia.com/investing/corporate-bonds-introduction-to-credit-risk/
Regan, P. (n.d.). Bonds. MBA Math. Retrieved from https://www.mbamath.com/Dashboard#/subjects/3/lessons/17
Regan, P. (n.d.). Net Present Value. MBA Math. Retrieved from https://www.mbamath.com/Dashboard#/subjects/3/lessons/18
Wessel, D., & Alcalá Kovalski, M. (2018, December 5). The yield curve – what it is, and why it matters. Brookings. Retrieved from https://www.brookings.edu/articles/the-hutchins-center-explains-the-yield-curve-what-it-is-and-why-it-matters/

Leave a comment