
Understanding a company’s financial health is essential for investors, stakeholders, and management. Financial ratios provide a comprehensive way to assess a business’s efficiency, profitability, liquidity, solvency, and valuation.
There are five main types of financial ratios that serve as key indicators of performance (Baltova, 2020):
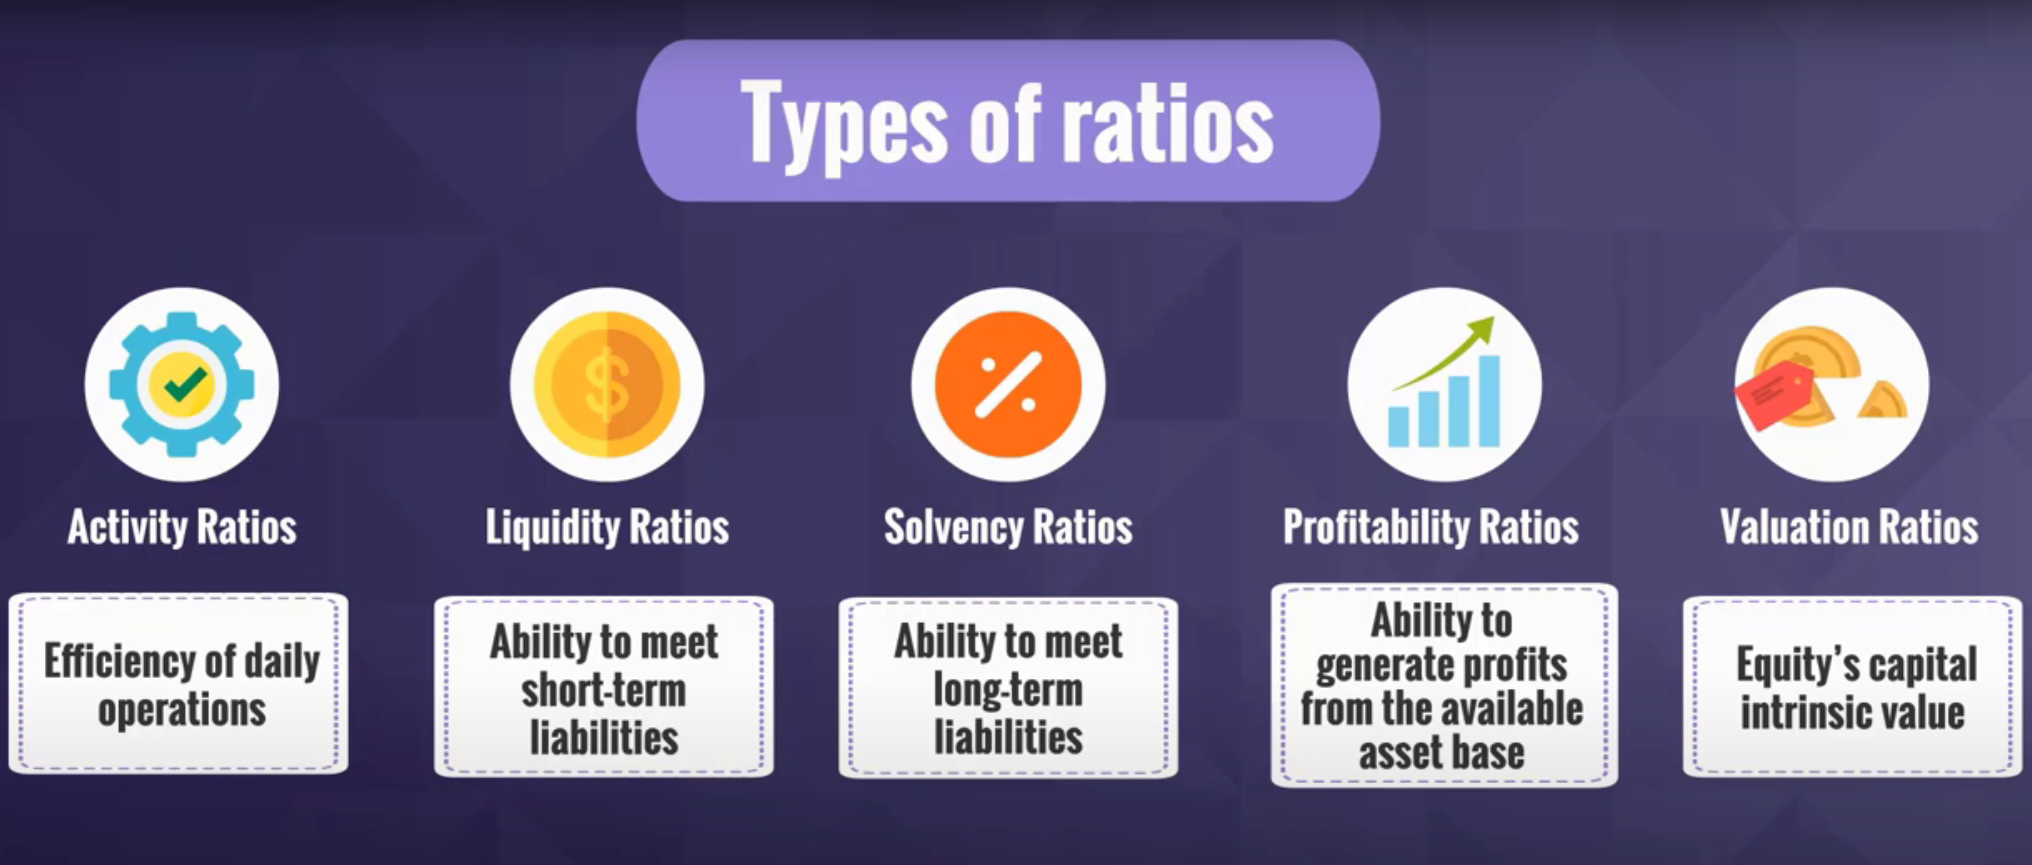
Following is an overview of what was covered during our ACC 505: Fundamentals of Business Decision Making – Evaluating Financial Health module taught by Dr. Carl Peterson. A few selected ratios are included under each category. A complete list of ratios and their meanings can be found in this video.
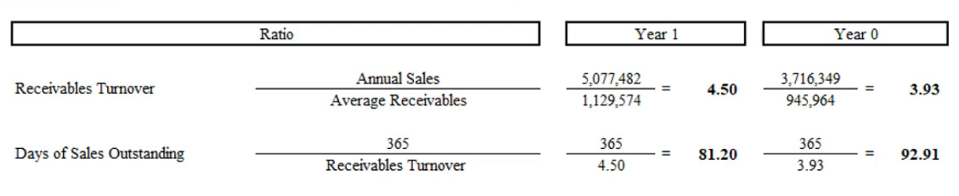
1. Efficiency / Activity Ratios
Activity ratios measure how efficiently a company utilizes its resources to generate revenue. For instance, receivables turnover, days of sales outstanding (DSO), and cash conversion cycle are three of the many activity ratios that can be calculated. A high receivables turnover suggests strong credit management, while a low DSO indicates that a company collects payments quickly, improving cash flow.
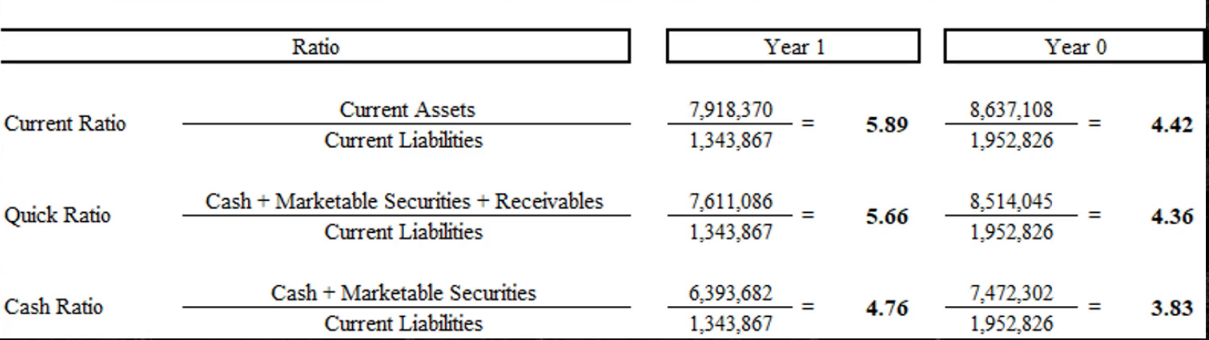
2. Liquidity Ratios
Liquidity ratios determine a company’s ability to meet short-term liabilities and provide measures on how quickly assets can be turned into cash. The current ratio, quick ratio, and cash ratio are widely used metrics. A higher current ratio (above 1) suggests that a company has sufficient assets to cover liabilities, while the quick and cash ratios exclude inventory for a stricter liquidity assessment.
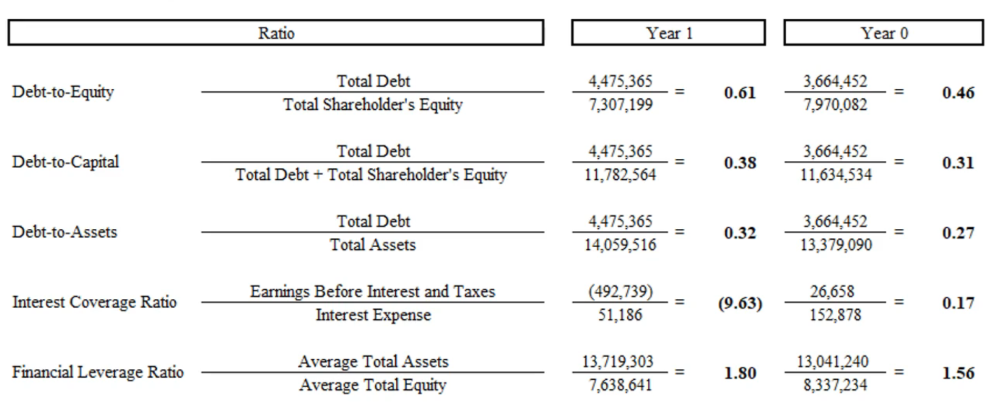
3. Solvency Ratios
Solvency ratios assess long-term financial stability by comparing debt levels to assets and equity. For instance, the debt-to-equity ratio, interest coverage ratio, and financial leverage ratio indicate how much debt a company has relative to equity and whether it can meet interest obligations. High debt levels can pose risks during economic downturns.
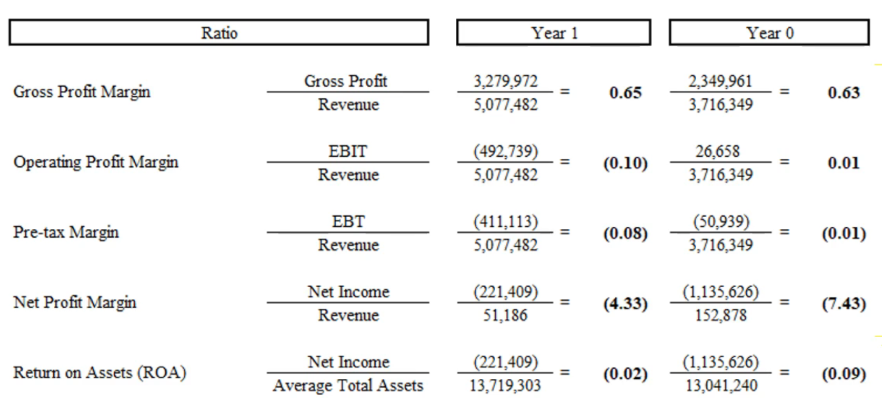
4. Profitability Ratios
Profitability ratios evaluate how effectively a company generates profit from its operations. A few key ratios include gross profit margin, operating profit margin, net profit margin, return on assets (ROA), and return on equity (ROE). Higher margins and returns generally indicate strong financial performance and efficient use of resources.
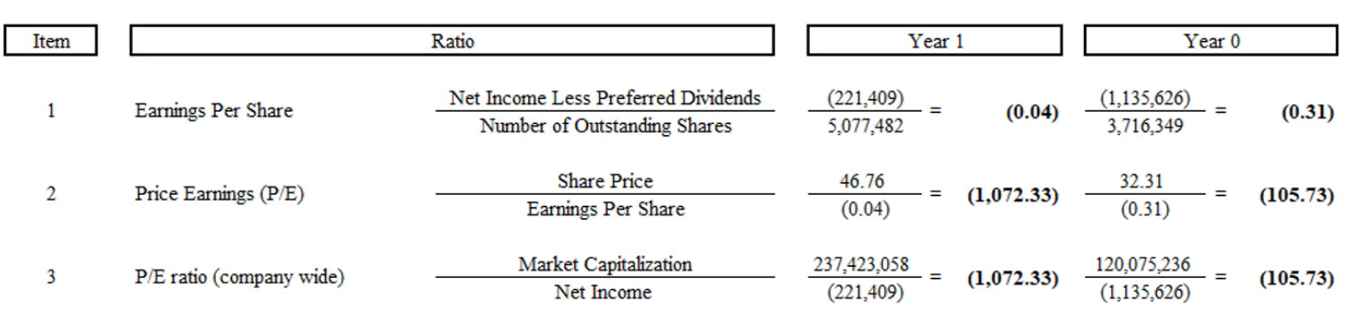
5. Valuation Ratios
Valuation ratios help investors determine the value of the equity. Important ratios include earnings per share (EPS), price-to-earnings (P/E) ratio, and dividend yield. A lower P/E ratio suggests undervaluation, while a high dividend yield indicates potential income for investors.
A really nice slide I took away from this series of lectures was the following which shows the important events related to the cash conversion cycle, which in turn helps calculate the working capital.
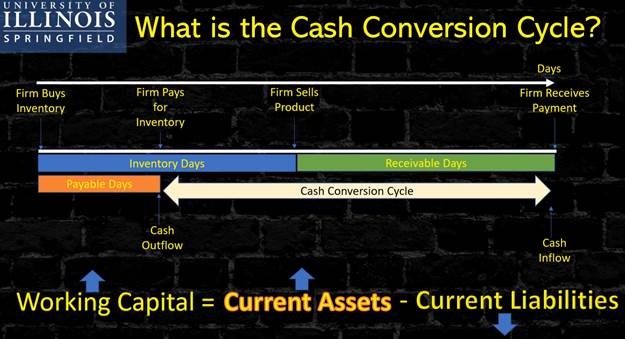
If the company is paying the suppliers on time for some reason, current assets increase while liabilities decrease. To make this happen, company needs a higher working capital and will have to ask investors to fund that higher level of working capital. This is also where it is important to recognize that profits do not guarantee good cash flow since it is quite possible for a company to report profits but go out of business (Boex, 2015). While profitable companies tend to have good cash flow, profitability alone does not eliminate the need for careful cash flow management. A company can be highly profitable on paper but still face cash flow issues due to factors such as delayed receivables, high inventory levels, large capital expenditures, or debt obligations. For instance, a fast-growing software company can sign multiple high-value contracts, recording large profits based on accrual accounting. However, if customers delay payments or if the company offers long credit terms resulting in long cash conversion cycles (Peterson, 2023), cash inflows may lag behind expenses like salaries, rent, and supplier payments. As a result, despite high profitability, the company could struggle to pay its bills on time – a situation that could lead to liquidity problems or even bankruptcy.
Financial ratios, while valuable, need to be interpreted in context for a more accurate picture of a company’s financial health. Ratios should never be looked at in isolation, as they can present misleading conclusions without understanding the underlying factors. For example, a high current ratio—often seen as a sign of strong liquidity—may not always be positive. If a company has a significant amount of its assets tied up in debt, the apparent liquidity might mask financial stress. Companies with large debts may struggle with interest payments despite having a high current ratio. It’s essential to look at the debt-to-equity ratio and assess whether the company can handle its liabilities in the long term. Similarly, rising debt may raise concerns about a company’s ability to generate sufficient earnings to cover its obligations. However, rising debt could also indicate that a company is in a growth phase, using leverage to finance new opportunities, acquisitions, or capital projects. In such cases, it’s critical to evaluate the interest coverage ratio and return on equity (ROE) to see if the debt is contributing positively to growth and returns. If a company is using debt to fund expansion and is generating higher revenues and profits as a result, it could still be a sign of healthy growth despite the increased leverage.
Financial ratios provide valuable insights into a company’s operational efficiency, liquidity, long-term stability, profitability, and stock valuation. By analyzing these metrics, while considering the broader context, including industry norms, business strategy, and economic conditions, investors and business leaders can make informed decisions to improve financial performance and assess potential risks.
References
Baltova, A. (2020, December 24). Types of financial ratios [Video]. YouTube. https://www.youtube.com/watch?v=FNYTVDRNpjs
Boex, A. (2015). Why cash flow is more important than profit. Nebraska Business Development Center. Retrieved from https://www.unomaha.edu/nebraska-business-development-center/_files/publications/cash-flow.pdf
Peterson, C. (2023, February 27). Lecture 9.2: Activity ratios – What is the cash conversion cycle? University of Illinois Springfield. Retrieved from https://uispringfield.instructure.com/courses/15569/pages/module-7-lecture-materials-lecture-9-2-2

Leave a comment