Some Preparation Tips for PMP

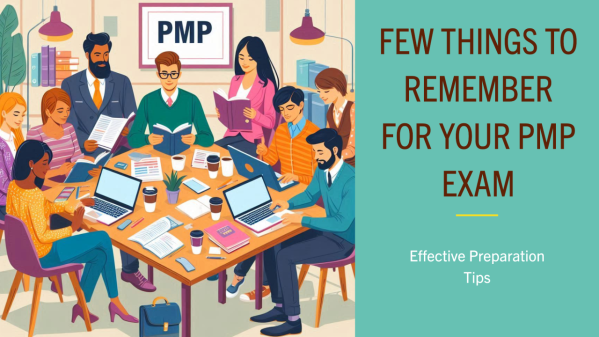
Lots of videos and blogs around what to study, how to prepare etc, but I wanted to share a few key points that I found useful to remember for the exam. My own exam prep details I included at the bottom in case anyone’s interested in reading my experience (I spent a total of 4... Continue Reading →

Creating PDF Documents with R/RStudio

For something I’m currently working on I wanted to create some PDF reports so that I can share the results with others via email. Turned out creating PDFs to output the values from R dataframes is not so straightforward after all. If it’s a ggplot type graphic, easiest is probably to do something like: which... Continue Reading →

Launching Spyder on Windows

If you install Spyder using any of the standalone installers after installing Python, you’ll have trouble launching the Spyder IDE. If you go to python_dir/Scripts, you’ll see the following: but clicking on spyder.dat will launch a command prompt for a split second and then disappear. This seems to be a common issues as asked here... Continue Reading →

Charting with WPF/C#

Visualization techniques have been evolving rapidly and with a growing trend towards ‘big data’ and ‘analytics’ there are so many technologies to choose from. If the development technology is not a constraint, D3 is arguably the best way to go, but if you are looking for some charting capabilities within a WPF/C# development environment your... Continue Reading →

Blog at WordPress.com.

Up ↑